Insights
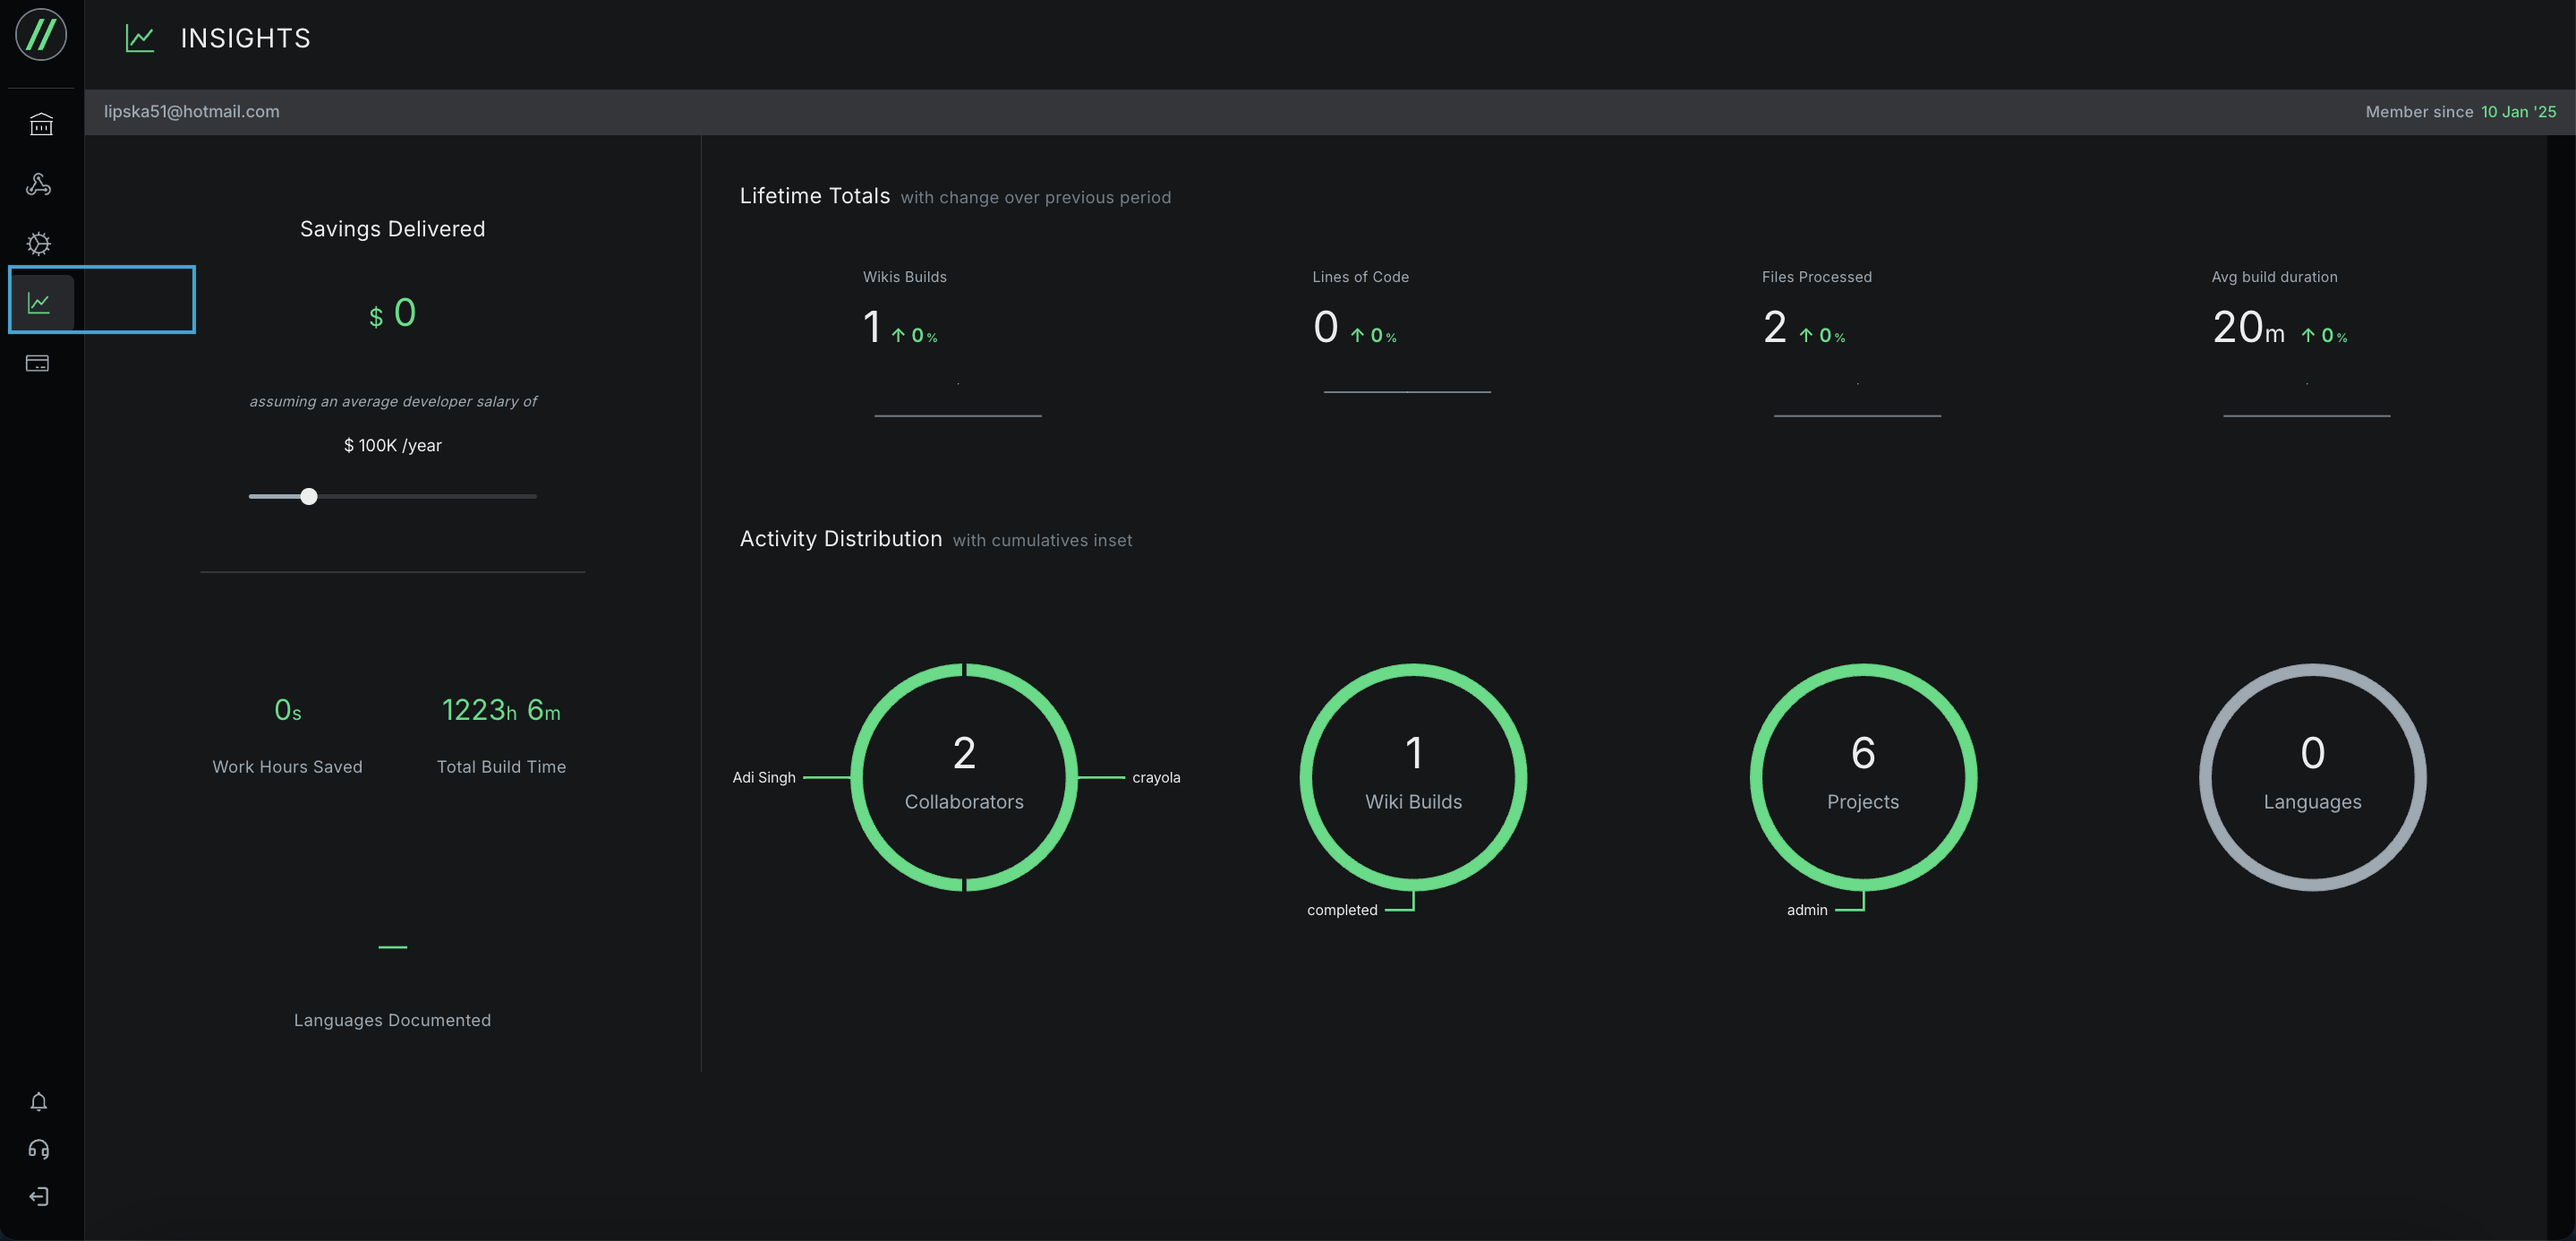
The Insights panel offers quantitative summaries about key usage metrics for your account.
These metrics help you track Komment usage across your team and make data-driven decisions about financial savings, productivity gains, and return on investment (ROI) that Komment provides.
All statistics in this view are refreshed after each pipeline run, ensuring you always have the most up-to-date snapshot of your usage.
You can access the Insights panel by clicking the graph icon in the main menu.
Overview
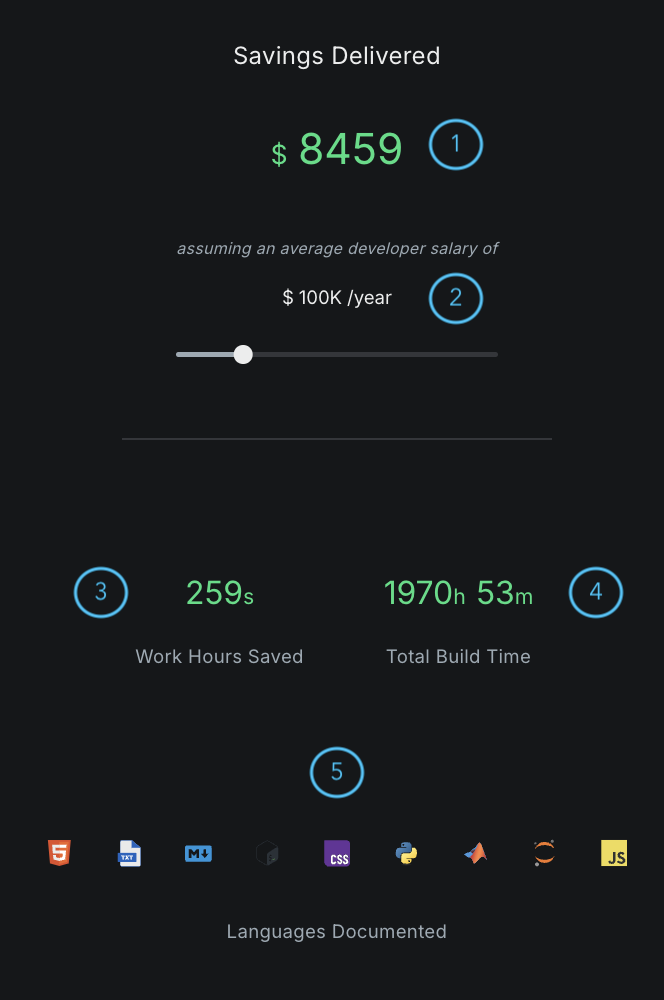
(1) Savings Delivered: This metric tracks the financial savings Komment has provided. It totals the dollar value saved across all projects you've accessed since becoming a Komment user.
(2) Developer salary: Set the average salary for developers in your organization to get a customized ROI estimate. Simply use the interactive slider to set a number. The default value is $100,000.
(3) Hours Saved: The time Komment has saved your team, calculated based on how long it would take a developer to manually write the same amount of wikis.
Our predictive models consider your codebase's type, complexity, and volume to estimate the time saved from manual documentation. They also factor in time saved on subsequent tasks due to the availability of reliable documentation.
(4) Total Runtime: The cumulative time Komment has spent processing and generating wikis for all your projects.
(5) Languages Documented: A list of icons denoting the languages that Komment has documented in your repositories.
Lifetime Totals
Lifetime Totals provide details about your usage of Komment.
There are 4 Lifetime Total metrics:
- Wiki Builds: Total number of wikis built across all your projects. Each version of a wiki counts towards the total number.
- Lines of Code: Total lines of code documented by Komment since your registration. This count excludes blank lines, comments, import statements, and structural lines.
- Files Processed: Total number of unique files Komment has documented across all your projects.
- Average build duration: The average runtime of a pipeline for your projects.
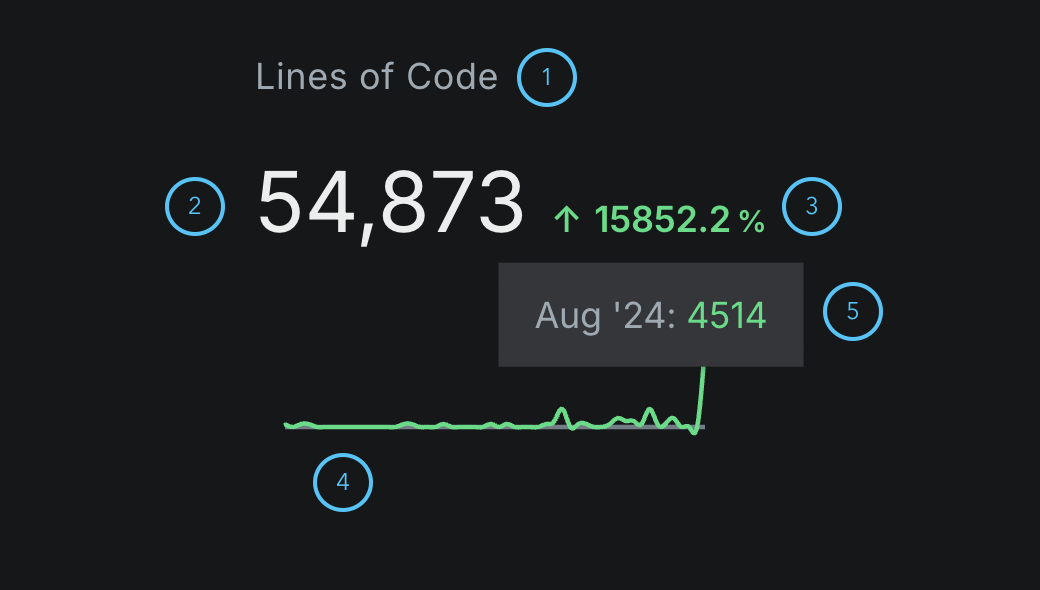
(1) Name of the metric
(2) Cumulative total for this metric since you started using Komment
(3) Percentage change in usage this month over the previous month
(4) Plot of monthly usage for this metric up until your most recently run pipeline.
(5) The exact value of the metric for a given month
You can hover over the plot to see an exact month by month breakdown of each metric.
Activity Distribution
These graphs further visualize a breakdown of your team’s activity on Komment. Inside of each graph is a total number for each activity metric, and the pie chart itself contains a detailed breakdown for more granular insights.
There are 4 Activity Distribution metrics:
- Collaborators: Total number of contributors across all your connected projects, broken down by the proportion of wikis created by each developer.
- Wiki Builds: Total number of wikis, including versions, built by Komment.
- Projects: Total number of projects you have connected with Komment.
- Languages: Total number of programming languages Komment has documented across your projects.
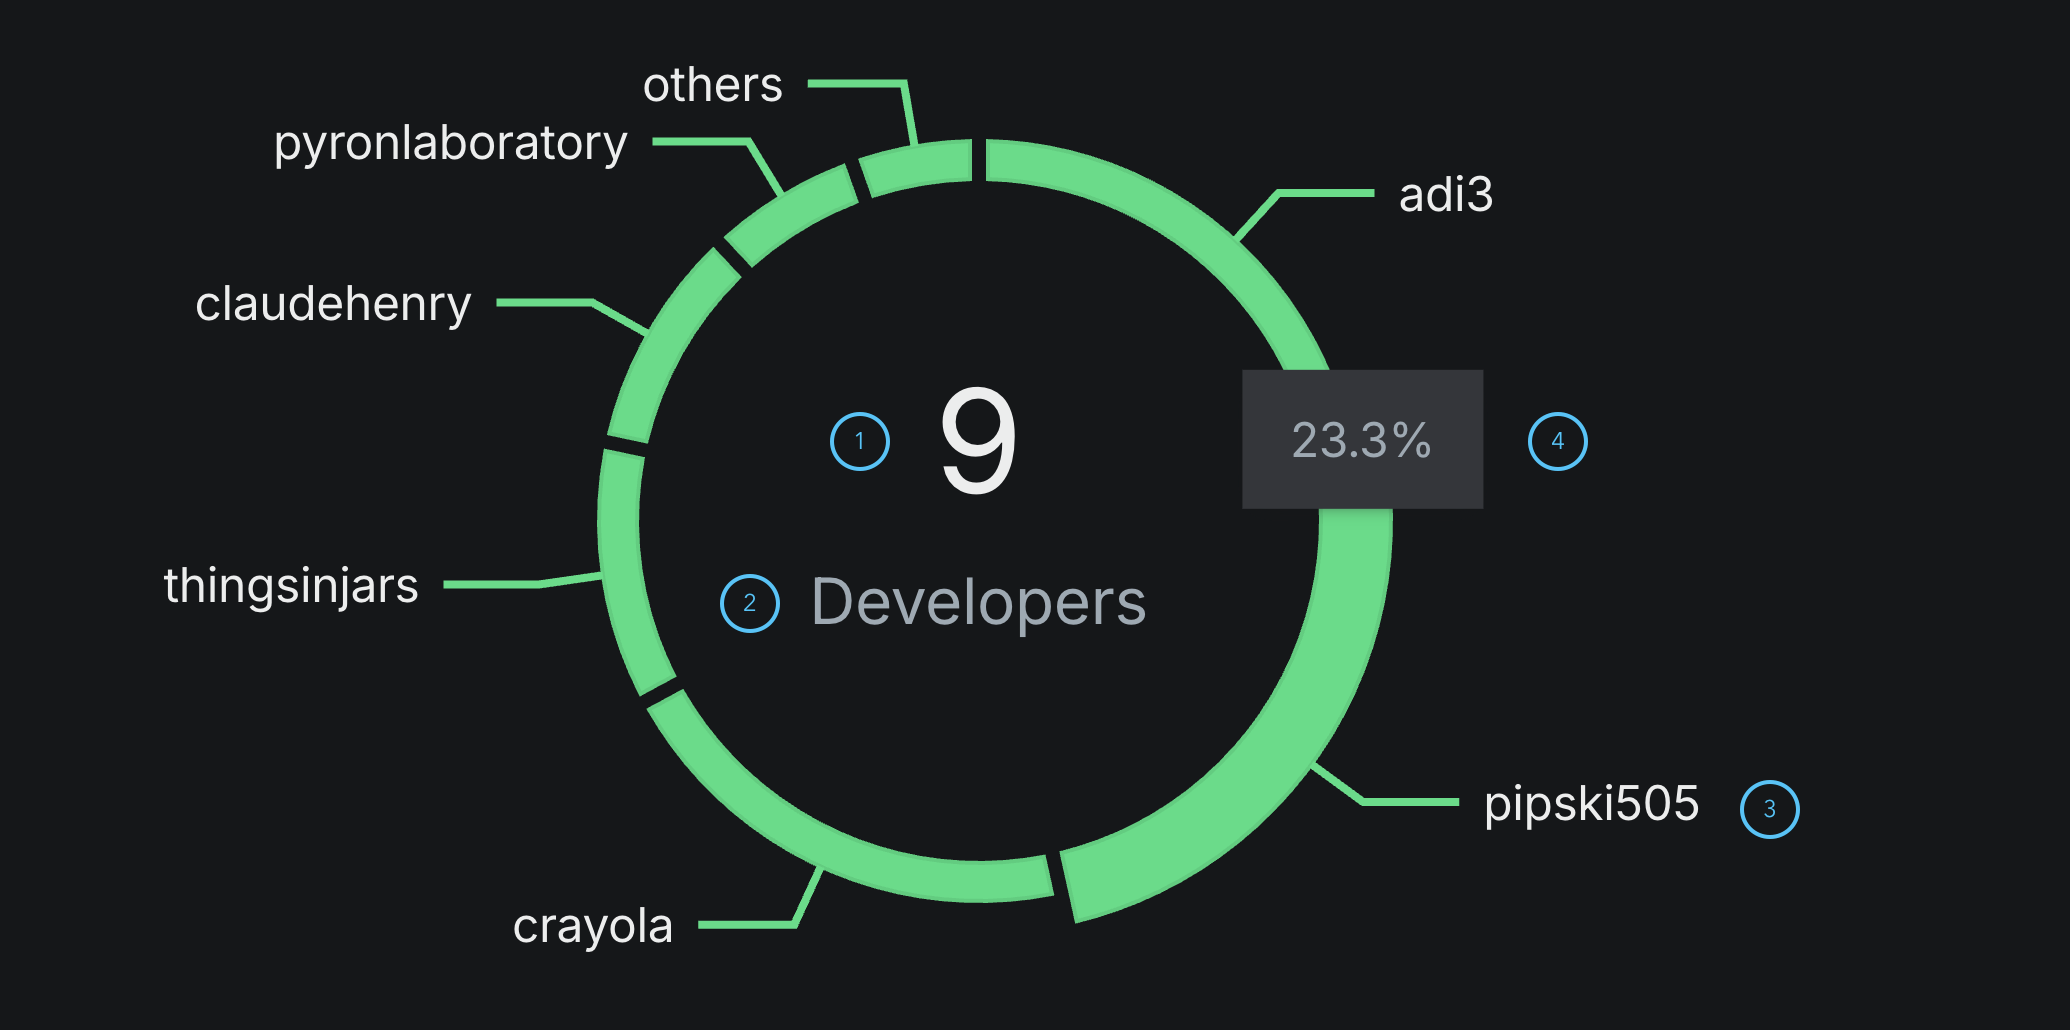
(1) Total number for each activity metric
(2) Name of activity metric
(3) Detailed activity distribution
(4) Percentage of highlighted segment in total