Logs
Overview
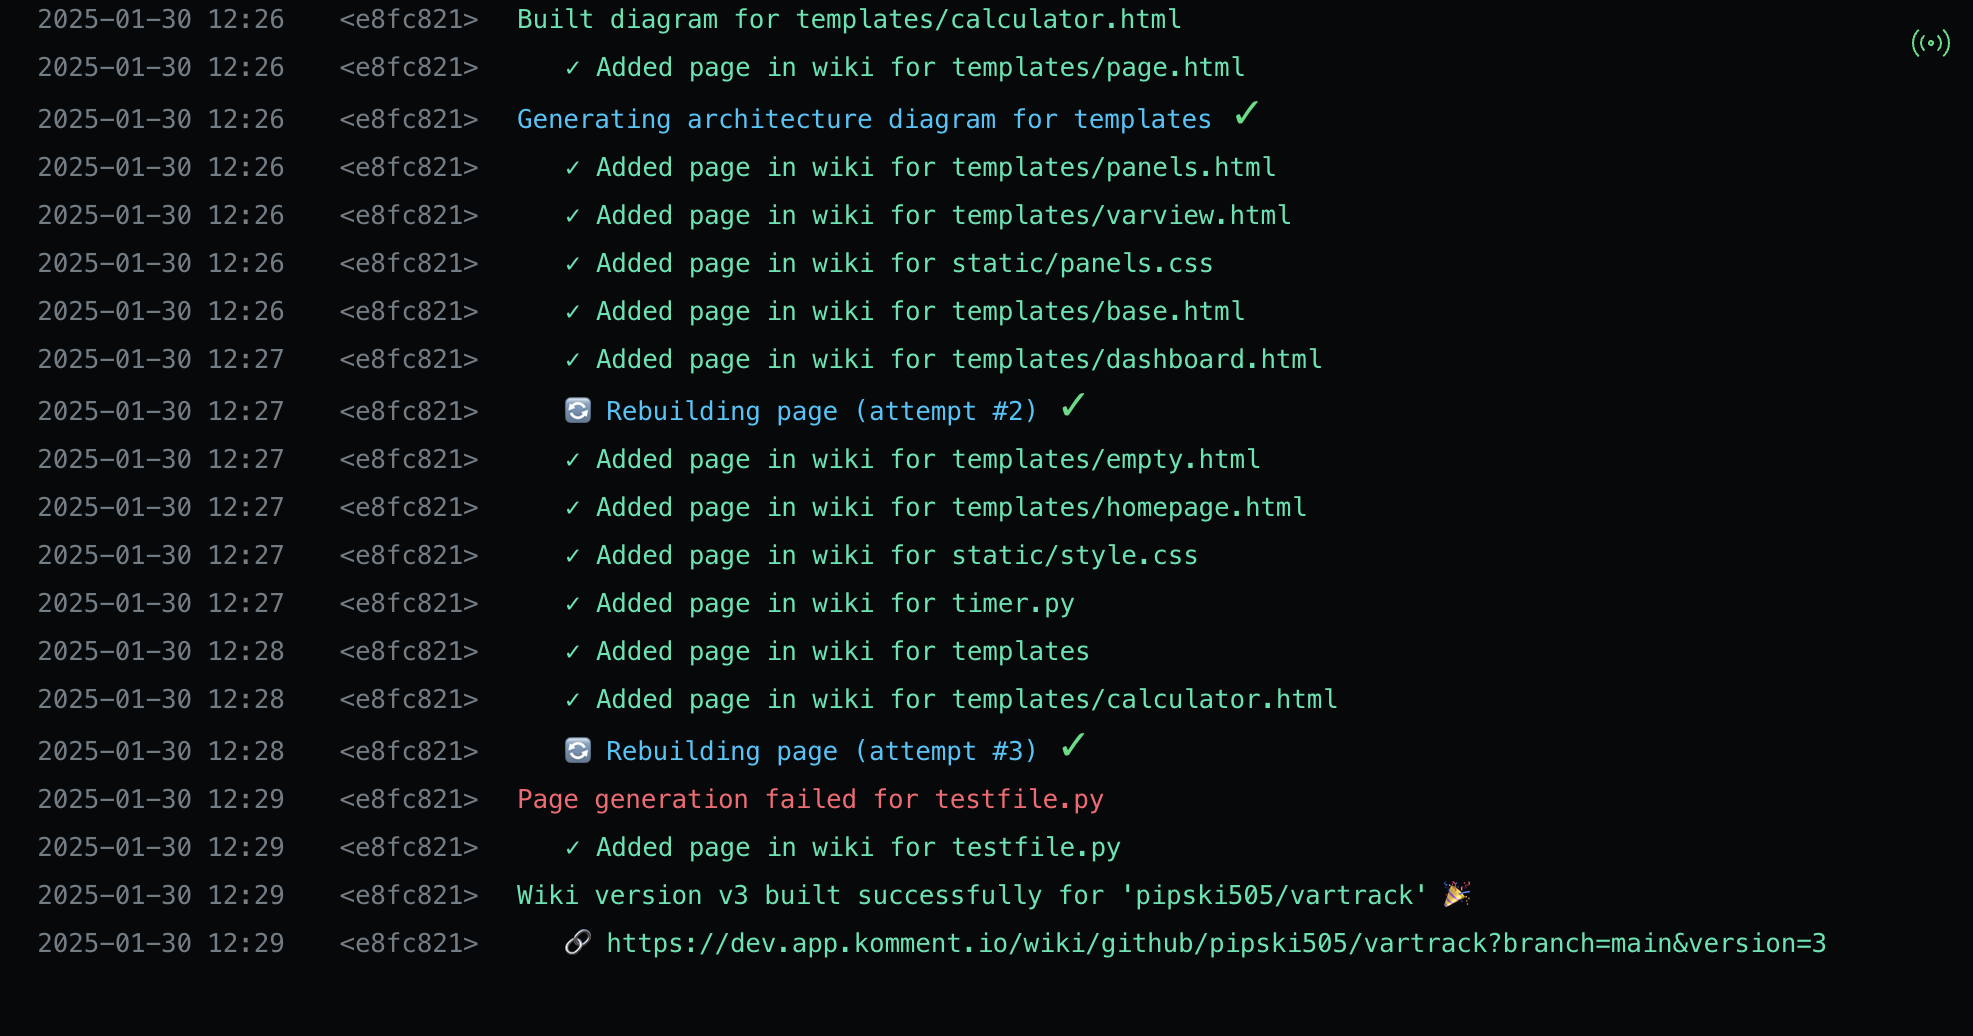
Pipeline logs provide an effective way to track Komment's steps and decisions during pipeline execution. Besides offering transparency into how the code is handled, these logs serve as a valuable debugging tool if your wiki doesn’t look as expected.
Pipeline Logs offer real-time updates on system and pipeline events, allowing you to easily monitor Komment's progress while it crunches your code. You can view the most recent messages in the logs window of the Pipelines view.
Note that logs associated with pipelines are broadcasted to all Komment users who have access to the associated wiki.
By default, the 500 most recent logs are displayed in reverse chronological order on page load.
Logs are color-coded to enhance readability. White indicates informational messages, blue shows in-progress tasks, amber typically signals an alert requiring your attention, and red denotes an unexpected failure. Green, of course, represents success.
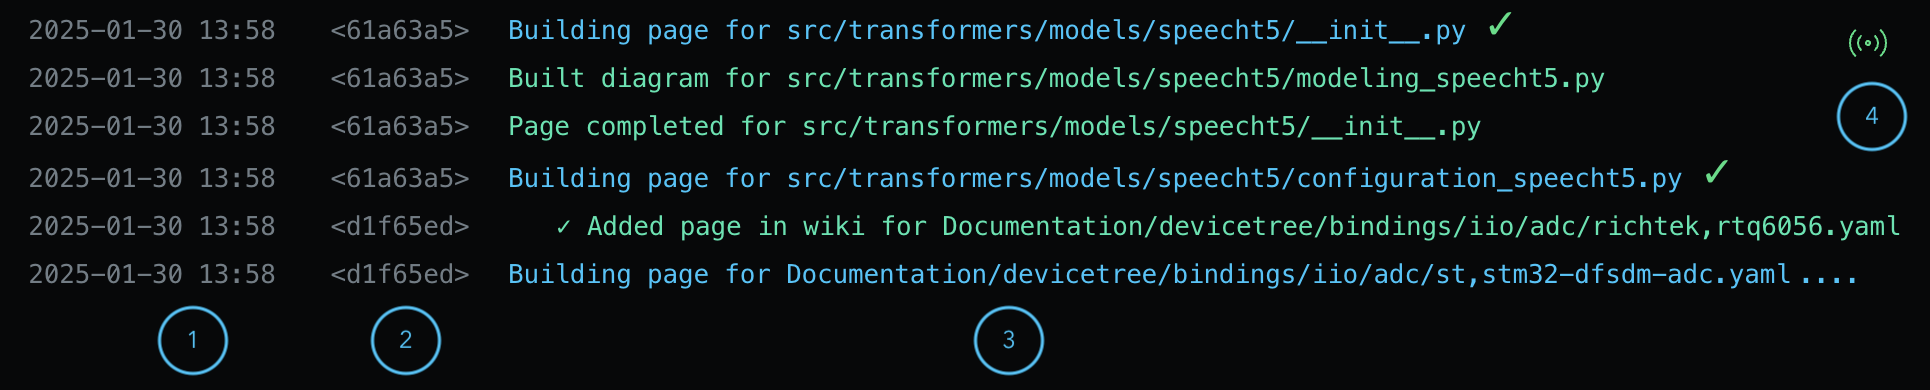
(1) Timestamp when the log was emitted.
(2) First seven digits of the pipeline ID associated with the log. If the log is a general update not tied to a specific pipeline, it is labeled as a system log.
(3) Information about the specific event or action, with relevant elements hyperlinked for easy reference.
(4) Shows the connection status between the Komment app and the backend server.
A green icon indicates a live connection, ensuring real-time updates to the view. The indicator turns red if the connection drops. A simple page refresh usually resolves this issue. In case the problem persists, please check the troubleshooting section.
Pipeline Logs
To view all logs for a specific pipeline, click on an entry in the Pipelines list. This will filter the content to only display logs associated with your selected pipeline.